Pipeline Monitoring with Prometheus and Grafana
This documentation describes how to integrate tekton-pipelines metrics with Prometheus and Grafana monitoring stack.
Prerequisites
Ensure the following requirements are met first before moving ahead:
- Kube prometheus stack is installed;
- Tekton pipeline is installed.
Integration Overview
Currently, there are two methods for integrating tekton-pipelines metrics with the Prometheus and Grafana monitoring stack.
Integration via Service Monitor
To implement Pipeline Monitoring using the Service Monitor resource, follow the steps below:
-
Create a Service Monitor resource file with the following configuration:
apiVersion: monitoring.coreos.com/v1
kind: ServiceMonitor
metadata:
  labels:
    release: prom               # kube-prometheus-stack release name
  name: tekton-overview
spec:
  endpoints:
    - interval: 10s
      path: /metrics
      port: http-metrics
      scrapeTimeout: 10s
  namespaceSelector:
    matchNames:
      - tekton-pipelines
  selector:
    matchLabels:
      app.kubernetes.io/component: controller
app.kubernetes.io/part-of: tekton-pipelines -
Apply the created resource to the
tekton-pipelinesnamespace:kubectl apply -f service-monitor.yaml -n tekton-pipelines -
Download the KubeRocketCi dashboard:
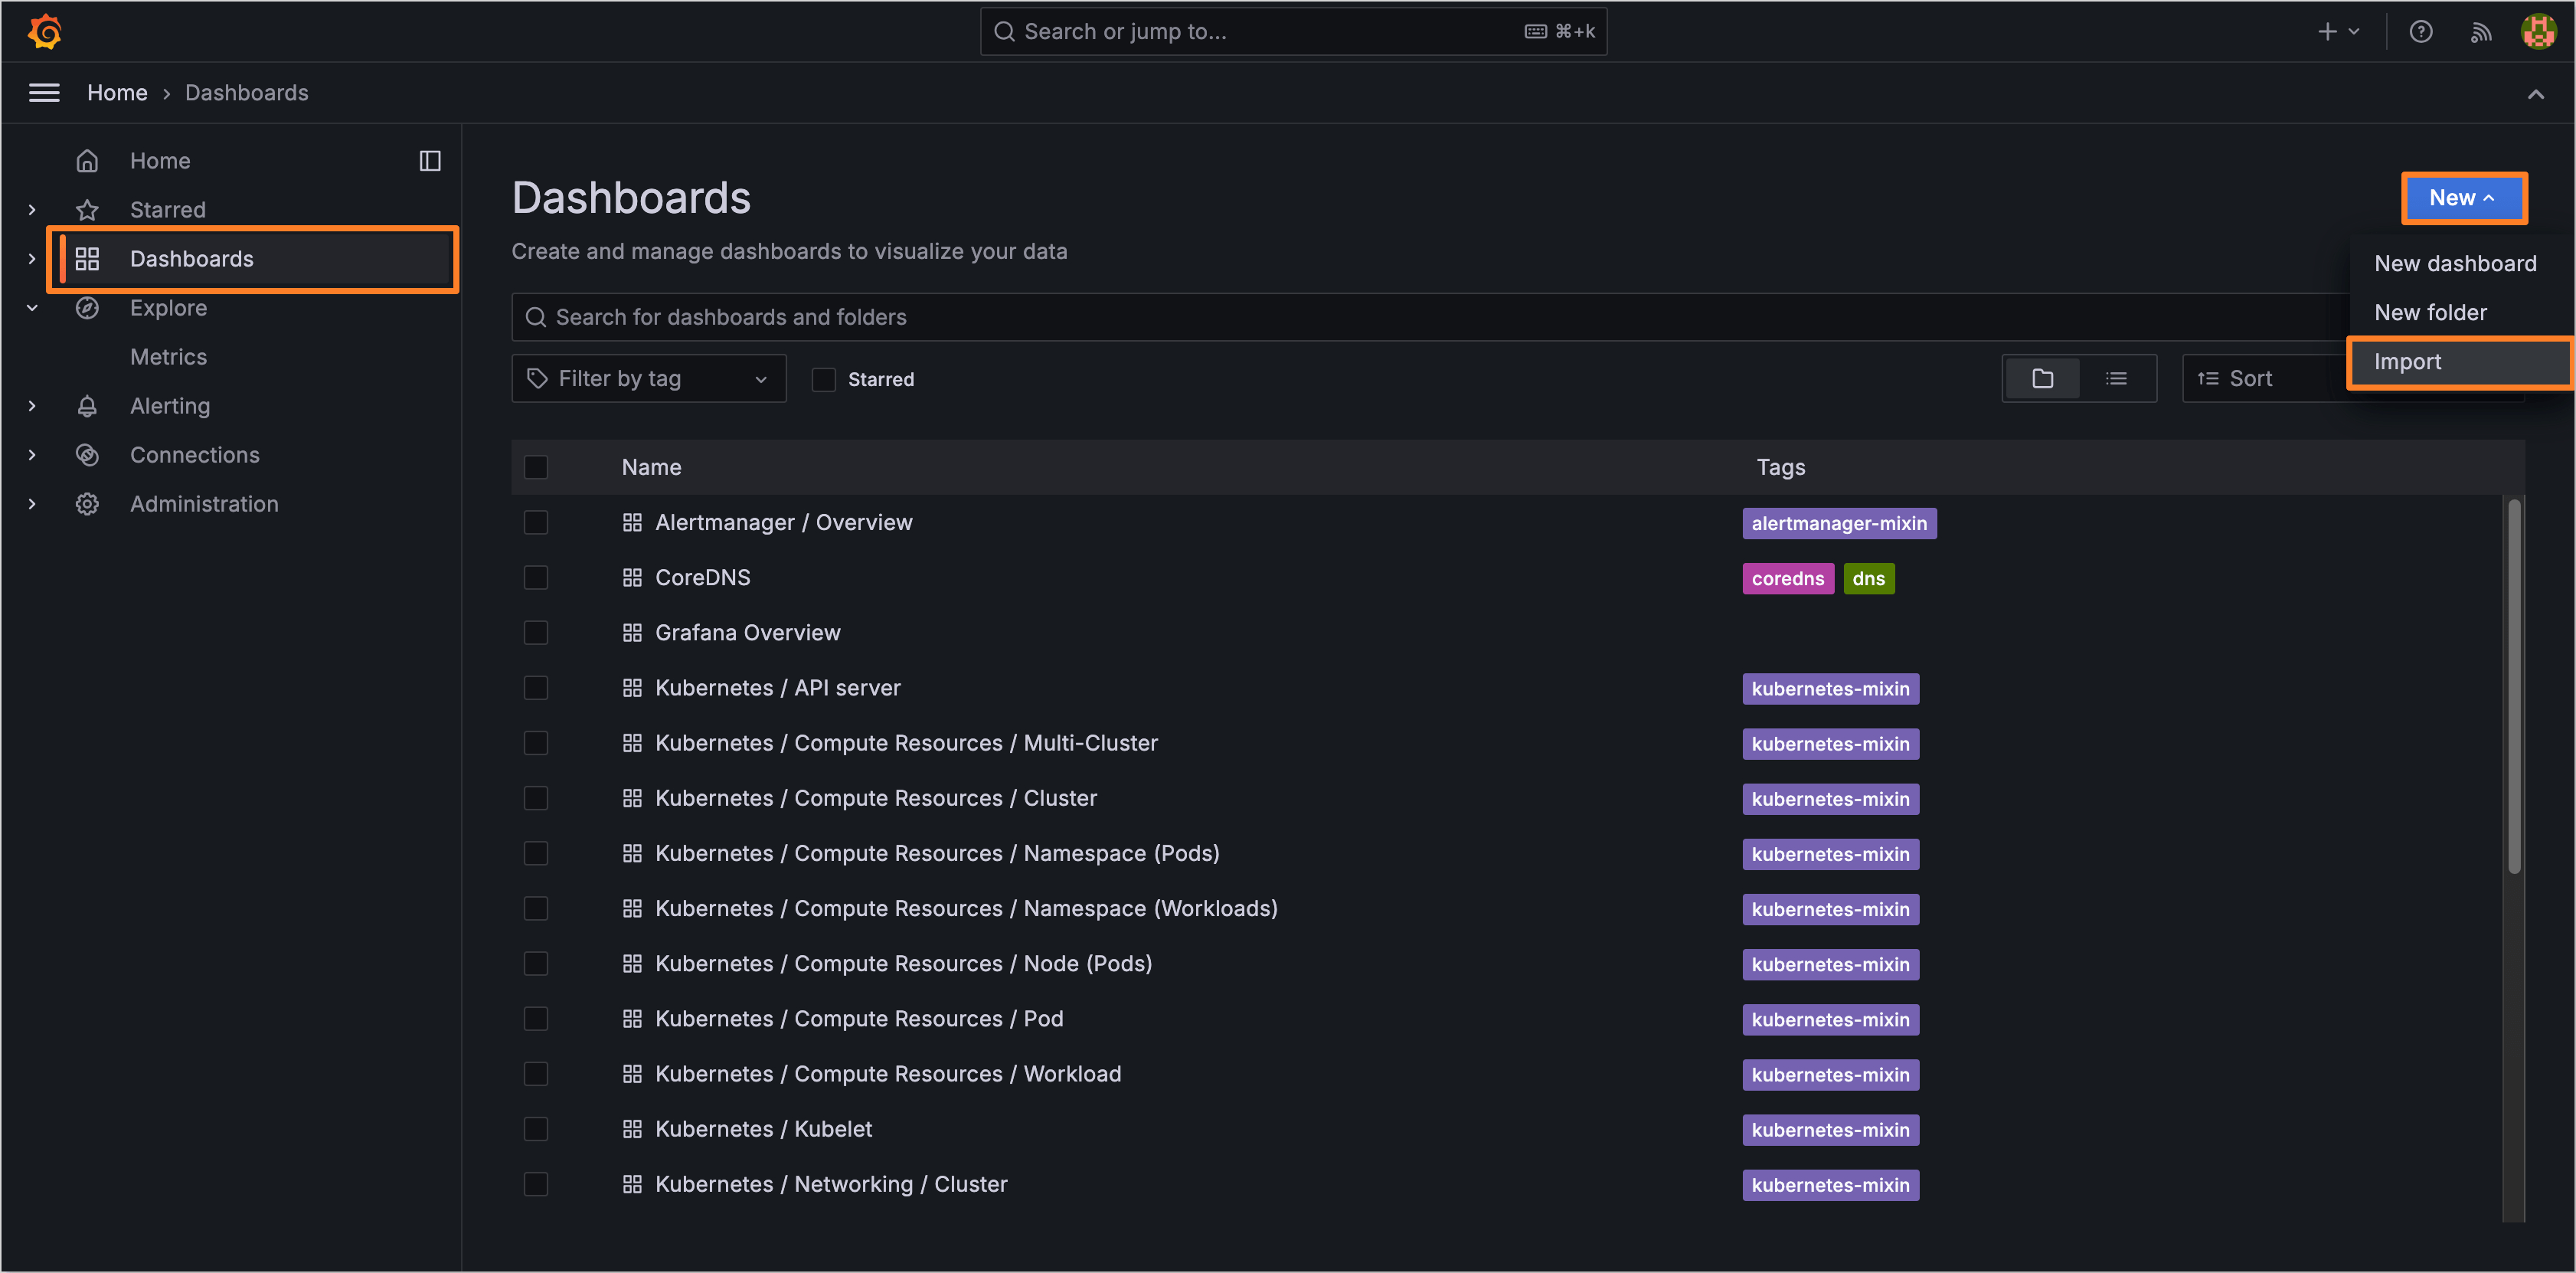
a. Click on the dashboard menu;
b. In the upper right corner, click on the
Newbutton. In the dropdown menu, click theImport;
c. Select the downloaded
18321_rev*.jsonfile;
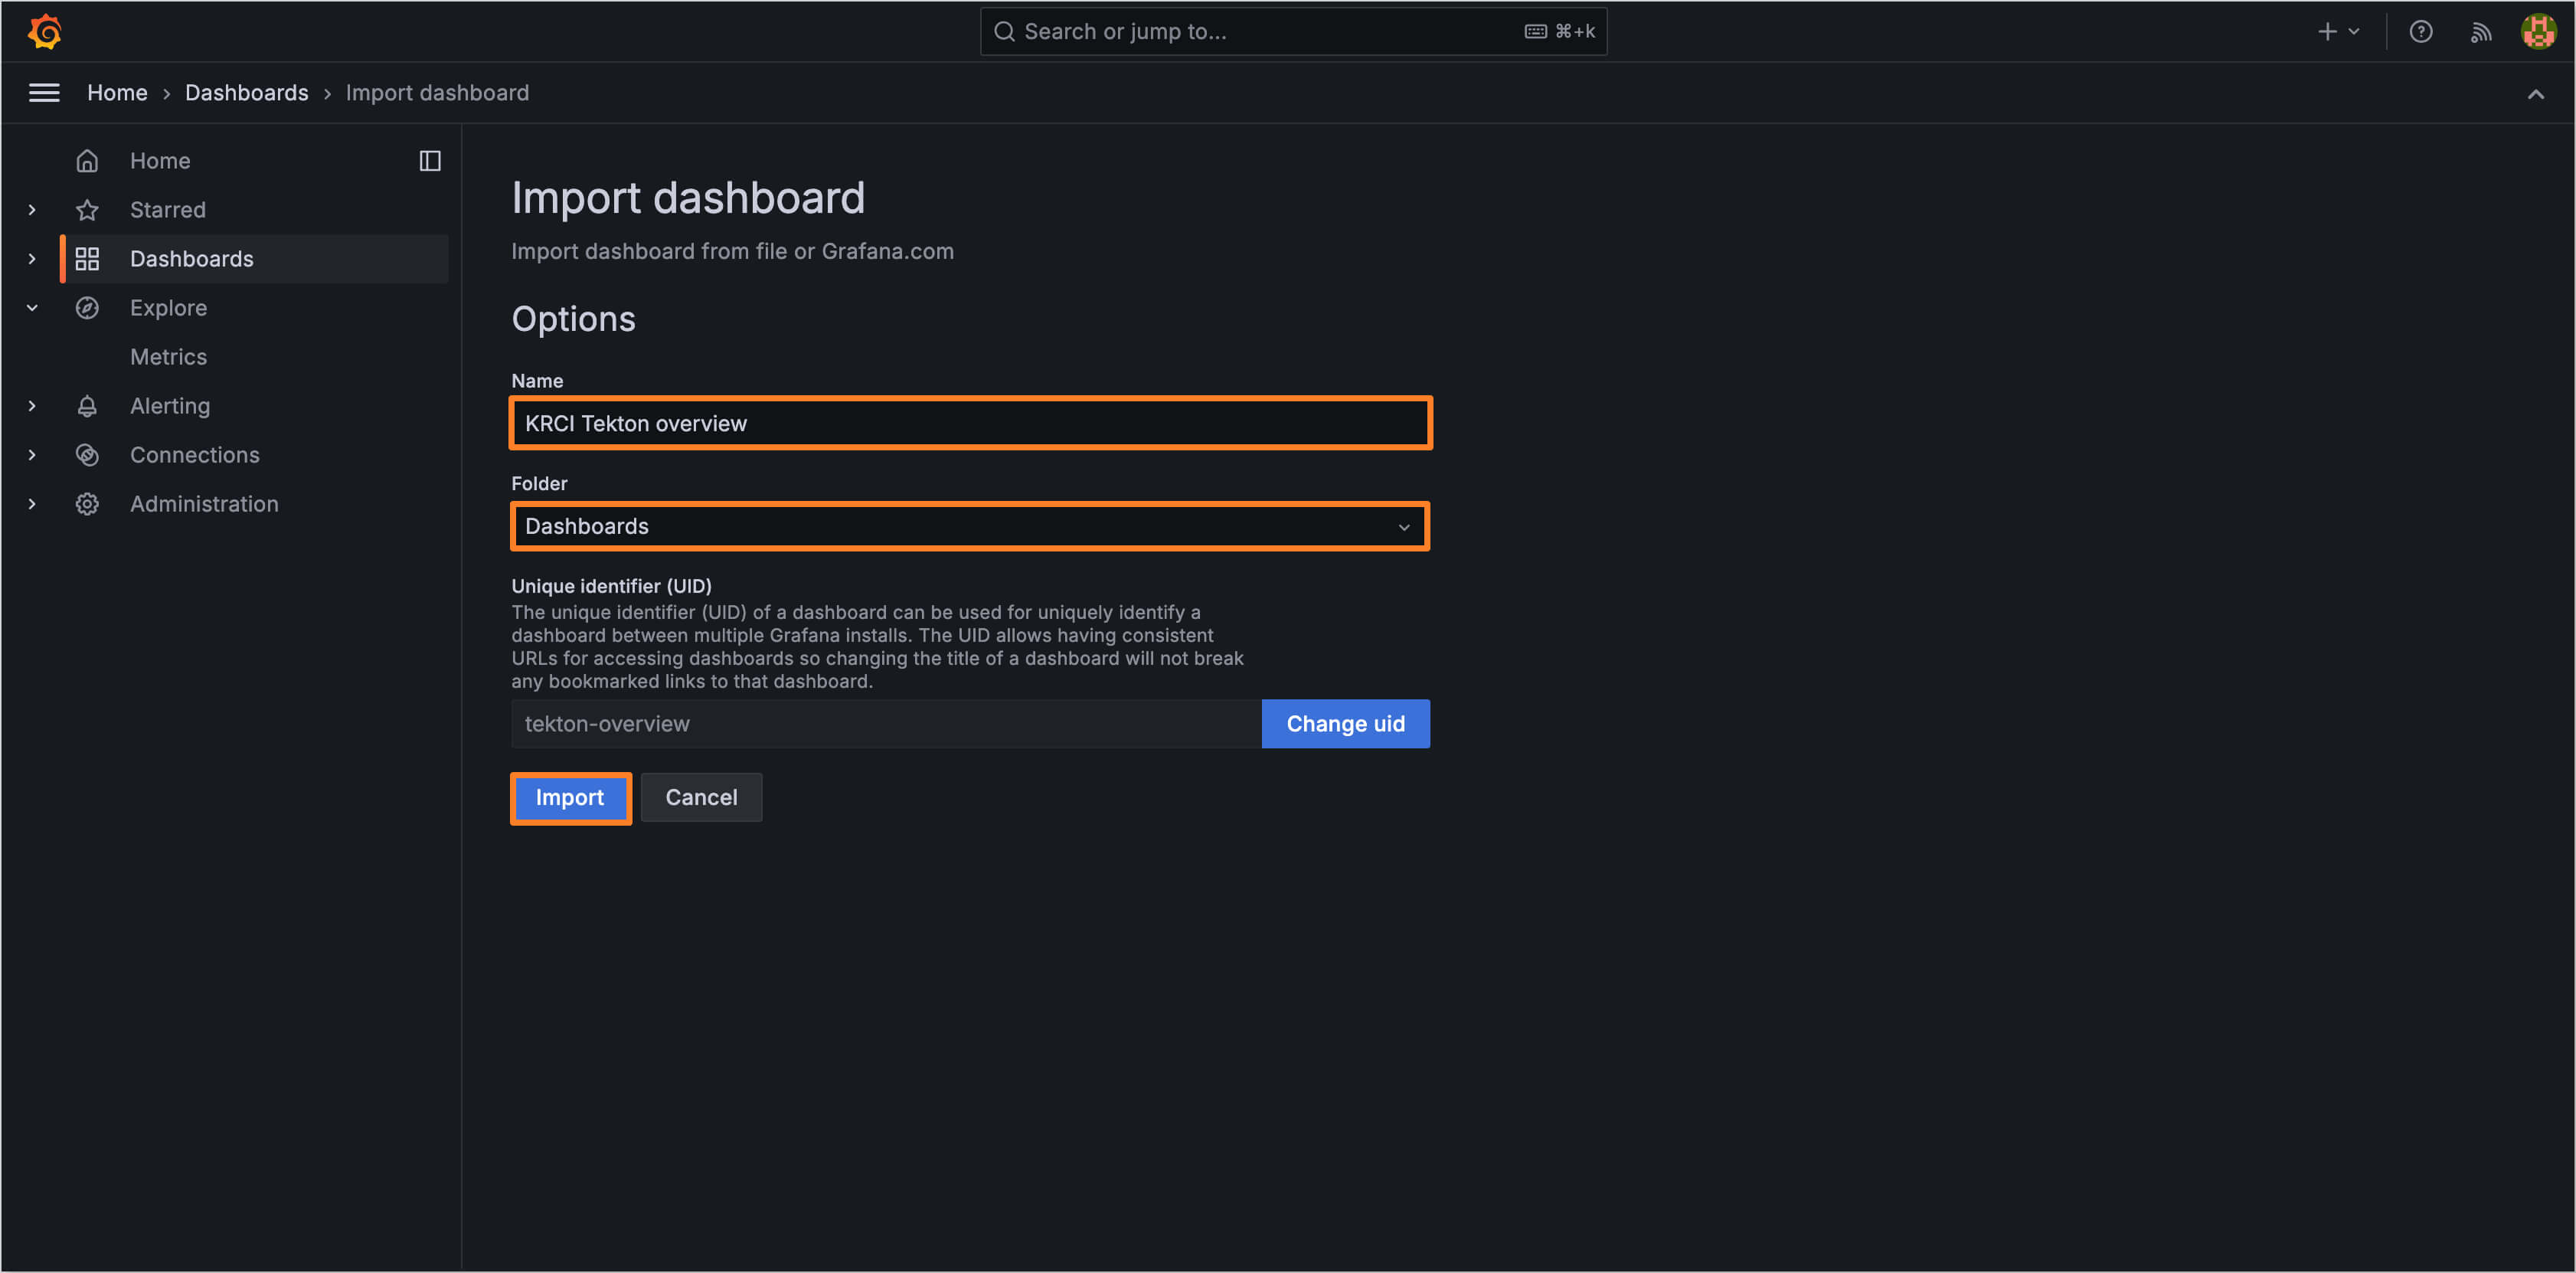
d. Type the name of the dashboard;
e. Select the folder for the dashboard;
f. Change the UID if necessary;
g. Click the
Importbutton.
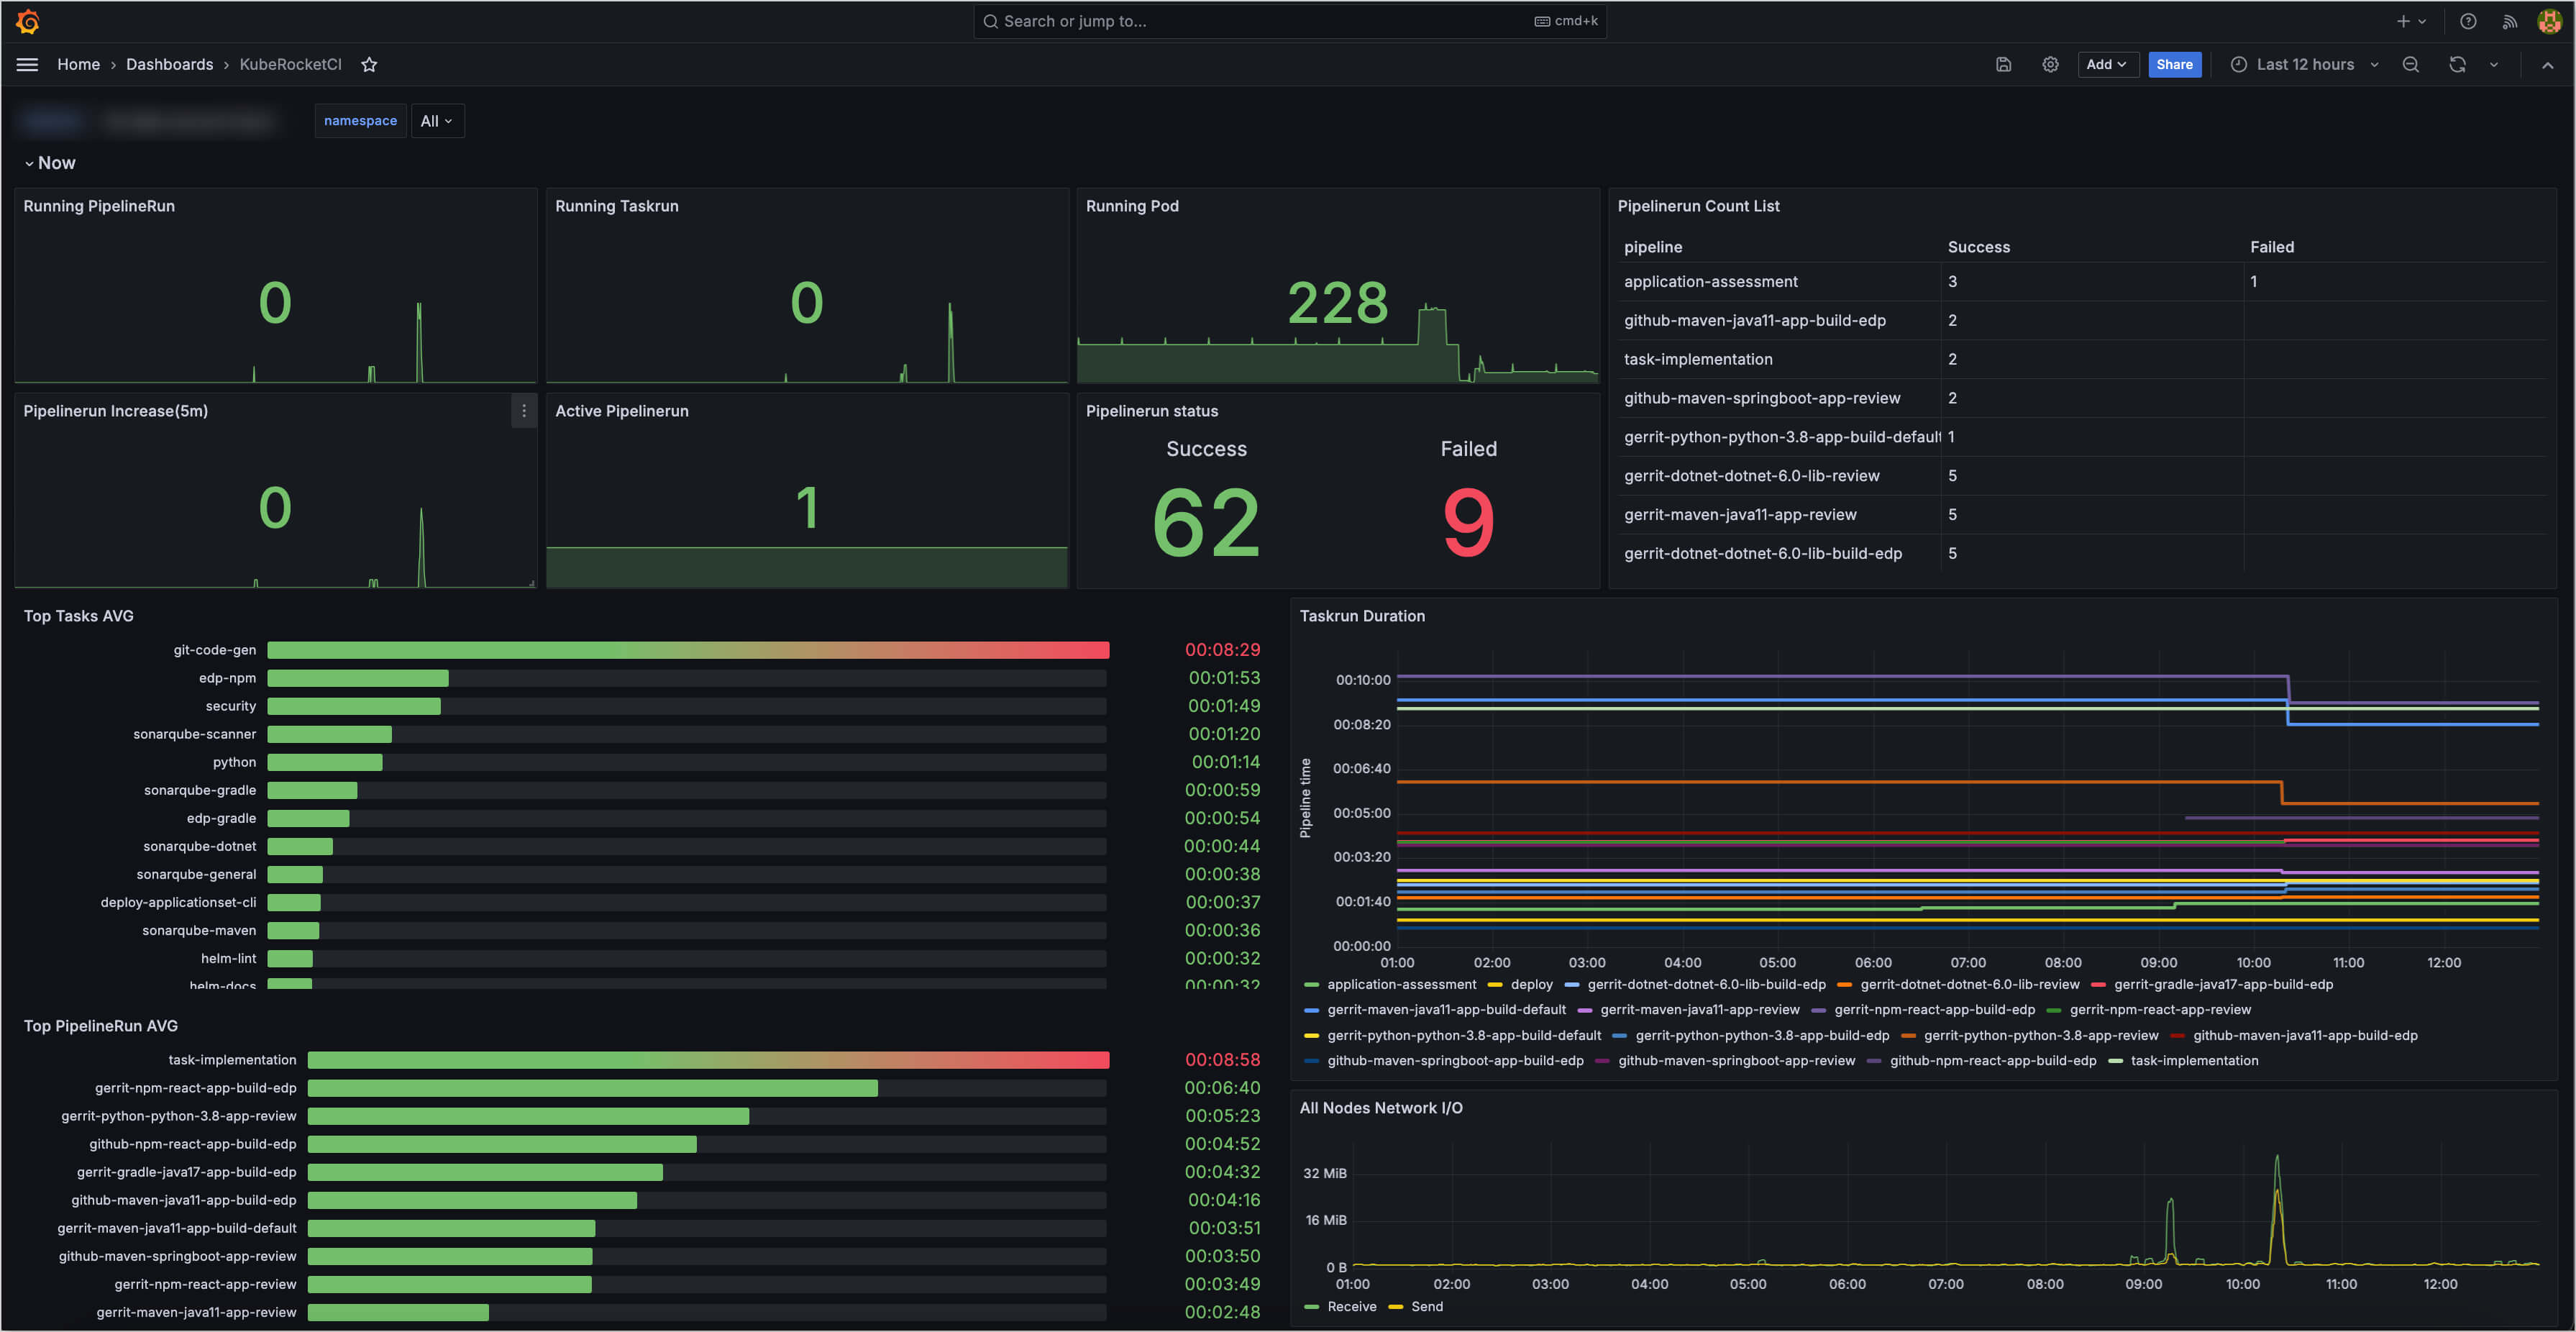
As soon as the dashboard procedure is completed, you can track the newcoming metrics in the dashboard menu:

Integration via edp-install Helm Chart
The edp-install helm chart allows to integrate tekton-pipelines metrics with the Prometheus and Grafana stack through the edp-tekton.grafana.enabled field in values.yaml file.
To enable integration, set the edp-tekton.grafana.enabled field to true and apply the changes to the cluster.
edp-tekton:
  grafana:
    enabled: true
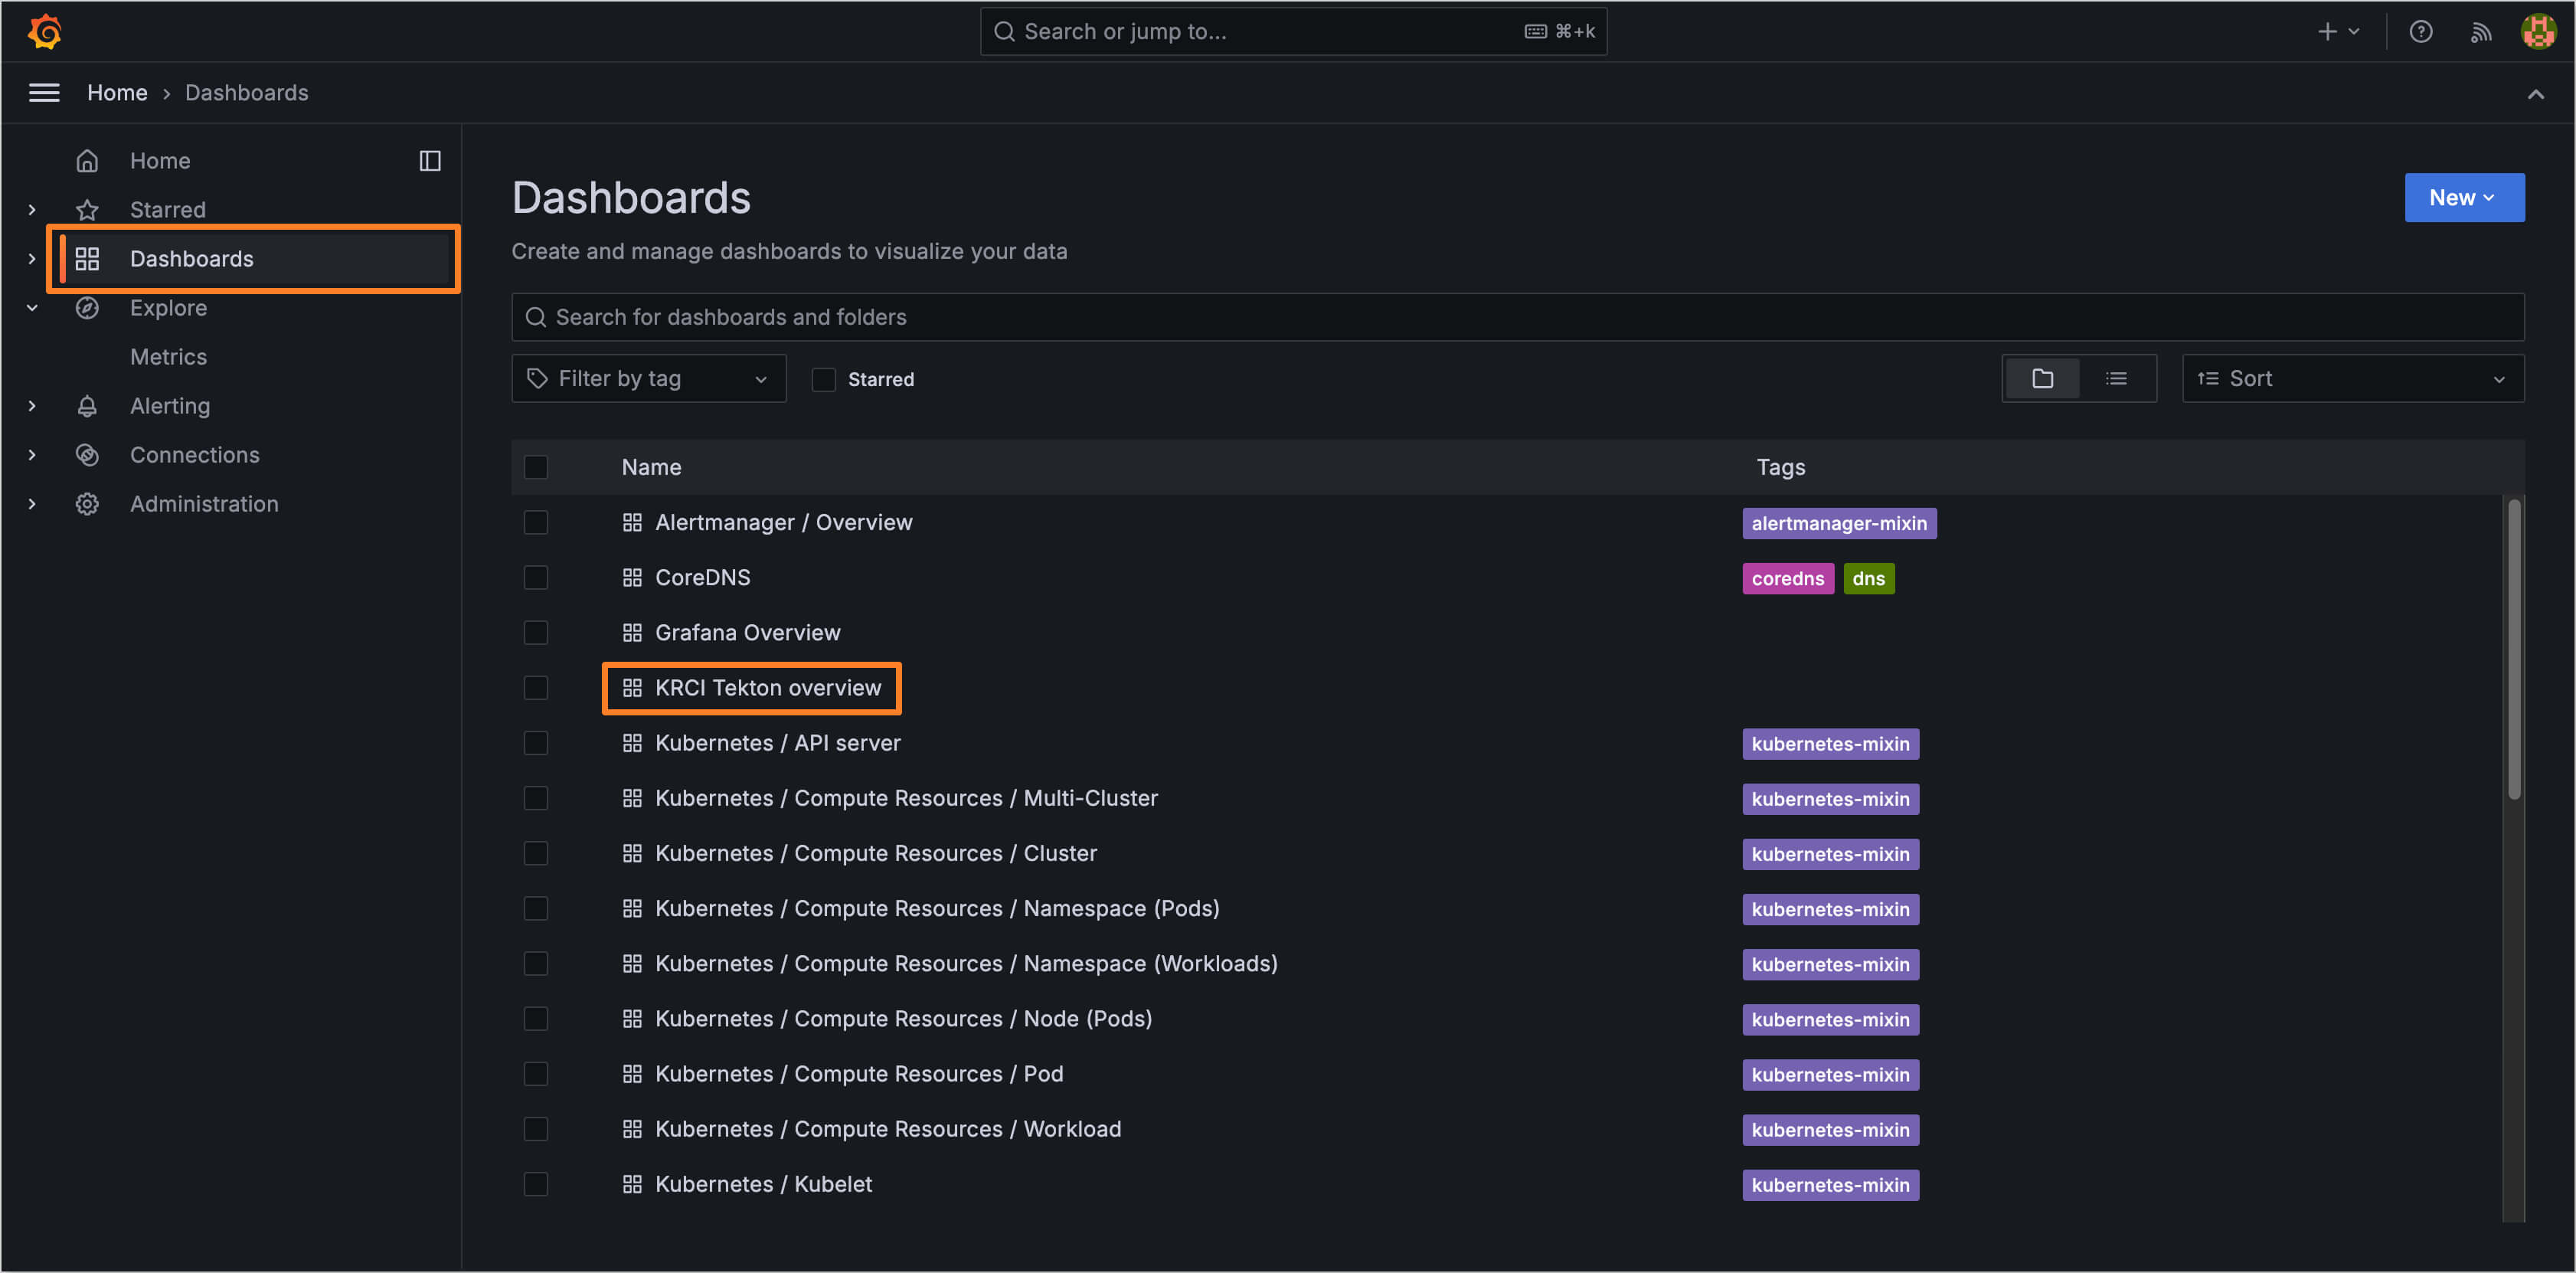
After the changes are applied, the tekton-pipelines metrics will be available in the KRCI Tekton overview Grafana dashboard:
